
Diameter increment of trees as a bioindicator of their vitality: a case study from Despotovac region
DOI:
https://doi.org/10.7251/GSF1727017SKeywords:
Austrian pine plantation, bioinicator, diameter increment, forest decline, Serbia, vitalityAbstract
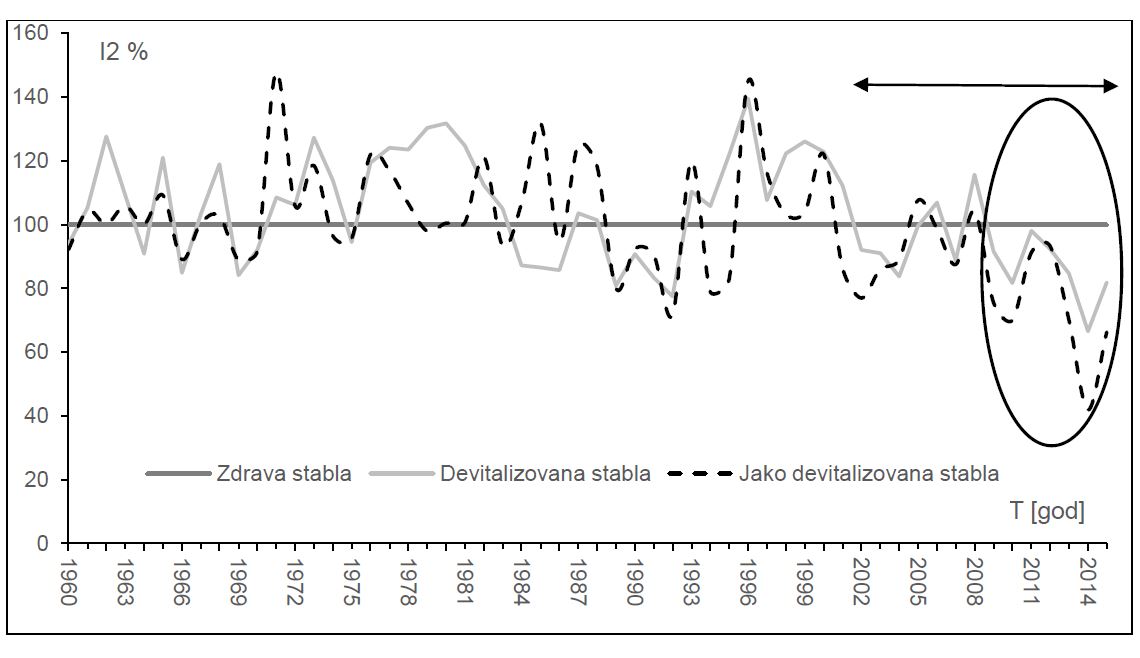
The research of the process of tree devitalization and decline was carried out in an artificiallyestablished Austrian pine stand in the area of Despotovac in Serbia. A diameter increment of 30 dominant trees classified on the basis of ocular assessment of the intensity of devitalization into the following three categories: healthy (with no obvious visual symptoms of decline), devitalized (with sparse crowns and noticeable but not developed symptoms of decline) and severely devitalized trees (trees with most of the crown dead) was studied. The stam discs for the analysis of their diameter increment were cutted at the breast height (1.3 m) in the field. In order to eliminate the influence of age on diameter increment and to facilitate mutual comparison of the obtained increment values we produced diameter increment indices for all three categories of the trees. These indices are performed as a ratio between the empirical and the fitted values of diameter increment (obtained using the appropriate regression equations) for each year of measurement. Having calculated these indices, double indices - I2 [%] were further determined in order to provide a quantitative estimate of the observed devitalization and determine the loss in the increment of devitalized and severely devitalized trees. We obtained these indices as a ratio of the diameter increment index of devitalized and severely devitalized trees to the diameter increment index of healthy trees, multiplied by 100 to obtain a percentage value. The results obtained for all three categories of trees (healthy, devitalized and severely devitalized) reveal variations in the values of diameter increment indices as well as overlapping of their flow lines for the period from 1960 to 2000. These variations can be characterized as random and anticipated. This conclusion could be supported by the average values of diameter increment obtained in the stated period for the three groups of trees whose vitality was studied. In fact, the obtained values are roughly similar (4.30 mm - healthy trees, 3.24 mm - devitalized tree and 4.12 mm – severely devitalized trees). The assumption that the variations in diameter increment were caused by random factors is further supported by the observed `illogical` results showing that the average increment of devitalized trees was in this period lesser than the average increment of severely devitalized trees. This fact indicates that with regard to this indicator, the trees in the category of severely devitalized trees (defined as severely devitalized on the basis of the assessments taken in 2015) were in the period from 1960 to 2000 'more vital' than the trees in the category of devitalized trees (also determined according to the state in 2015). The results also show that all the analyzed groups of trees had approximately the same responses both to the stimulating and to the limiting factors of growth in the given period, with no clear differences in the response 'pattern'. Clear and marked deviations in the increment flows of devitalized and severely devitalized trees from the increment flows of healthy trees were first recorded in 2008. The negative increment trend and significant losses in the increment values have been determined both in devitalized and heavily devitalized trees, with the changes being more pronounced in severely devitalized trees, which was to be assumed. Thus, in 2014 the increment of this category of trees amounted to slightly less than 42% of the increment achieved by healthy trees. Also, the average increment in the group of devitalized trees in this year accounted for only 67% of the increment of healthy trees. However, a detailed insight and analysis of tree increment flows (increment index) in these three groups reveals that the first differences in the increment flows of these tree categories occurred in 2000. In fact, although there have been several years with a relatively higher increment (index size) of devitalized and severely devitalized compared to healthy trees, there has been a markedly decreasing trend in the increment of these two groups of trees compared to the increment of healthy trees. This fact points to the conclusion that the process of real tree devitalization has been going on for the last 15 years with the visible symptoms appearing only in 2015. The results of the conducted research and analysis show that there are many strong reasons for monitoring the vitality of forests and predicting their future development. Monitoring activities should be continuous and varied and they must include the most typical natural factors and economic subjects, especially the ones that are allegedly prone to disturb the natural balance and cause devitalization (Vučković et al., 2005). Considering all the above points, it can be concluded that a specific place in the context of sustainable forest management should be placed to the researches of the ‘real' increment values and anticipated - ‘normal’ increment flows as well as deviations of the real from the expected increment and the causes that disturb the anticipated increment flows of trees and stands.
Downloads
Published
Issue
Section
License
Copyright (c) 2017 Branko Stajić, Slavoljub Dimitrijević, Marko Kazimirović, Vojislav Dukić

This work is licensed under a Creative Commons Attribution 4.0 International License.
